Tracer
The Tracer provides an interface for exploring the execution of a program. It is a tool for debugging code, as well as a teaching aid. By looking at the output at each level, it is possible to quickly narrow down what function is generating incorrect input. Currently, the tracer lang uses the semantics of intermediate-student-with-lambda.
1 Getting Started
To use the Tracer, set your language to #lang planet tracer/tracer. By default, nothing will be traced. To trace your code, insert one of the following expressions as the first expression in your file after the hash lang line: (trace-all), (trace-failed-checks), or (trace-explicit). After adding one of these, when you run your code, your preferred browser (as selected in Dr Racket under Edit, Preferences, Browser) will open up with the trace.
1.1 (trace-failed-checks)
Adding (trace-failed-checks) will trace only failing checks, including failed instances of check-expect, check-within, check-error, check-member-of, and check-range.
1.2 (trace-all)
Adding (trace-all) will trace all top level expressions and failed checks.
1.3 (trace-explicit)
Adding (trace-explicit) will trace failing checks and any expression wrapped in (trace ...).
2 Understanding The Display
Running the following code:
#lang planet tracer/tracer (trace-all) (define (fib n) (if (<= n 1) n (+ (fib (- n 1)) (fib (- n 2))))) (define (fib-iterative n) (local [(define (iter a b i) (if (= i n) a (iter b (+ a b) (add1 i))))] (iter 0 1 0))) (fib 5) (fib-iterative 5)
would initially load the trace shown below.
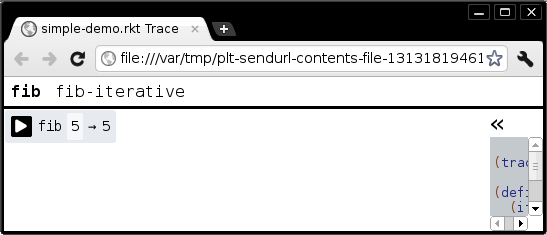
To view the trace of (fib-iterative 5) instead of the trace of (fib 5), click on fib-iterative in the tab bar along the top.
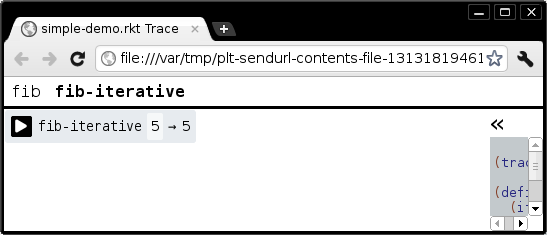
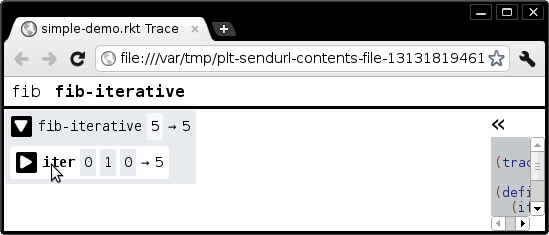
The tab bar along the top will display each of the top level function calls, whereas the body of the page shows the trace for a single top level function call. To see more detail about a function, including the subcalls that it made, click on the arrowhead to the left of the function name.

Each box in the tracer corresponds to a call of a user-defined function. A call is a child of another call if the child call appeared within the body of the parent function. The top portion of a call shows its function name and the arguments passed to it. Clicking on the function name will highlight the definition of that function in the code.

Clicking the function name again will close the code pane.
If you want to see where a function was called, rather than it’s definition, click on the result.
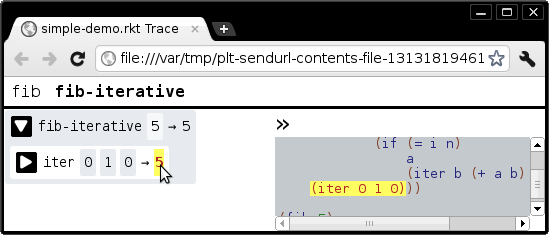
You can also close the code pane by double clicking on it, or by clicking on the button along the top of the code pane.
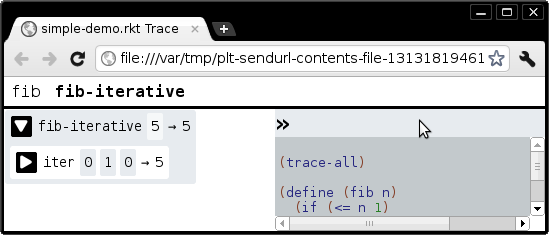
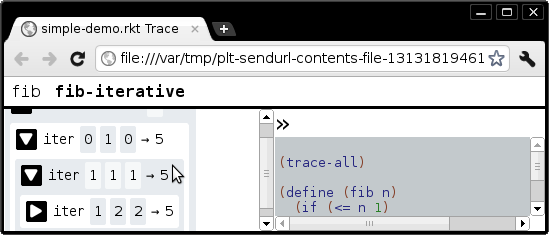
Once the trace is too large to display on the screen, you can move the trace by clicking and dragging, or by using the scroll bars.
2.1 Check Expects
Note: this section shows traces of various pieces of code, not only the code explictly listed above.
If a call in the trace corresponds to a check-expect, the call is colored red if it failed. If the call is colored green if it passed.
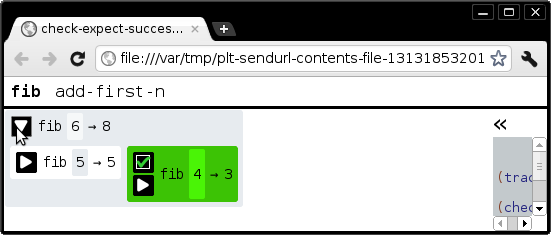
The checkbox button appears as well, which will highlight the check-expect that corresponds to the call.
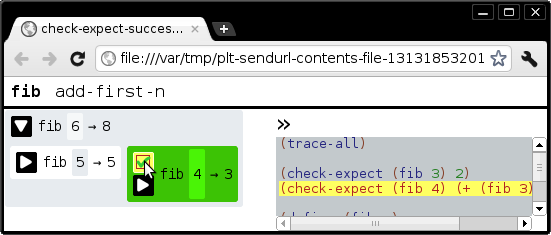
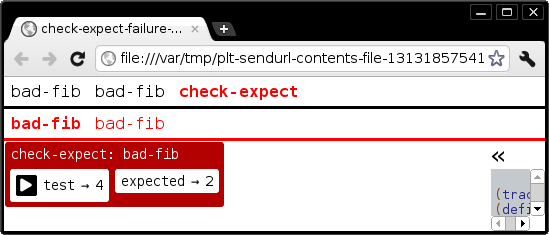
If there are any failed check-expects, a new check-expect tab appears in the tab bar. Clicking on the check-expect tab shows a second tab bar with the failed check-expects. The trace of the check-expect shows how the tested value and the expected value were computed.
3 Big Bangs
Tracing a big-bang will add a second tab bar with a timeline of all of the calls from the big-bang.
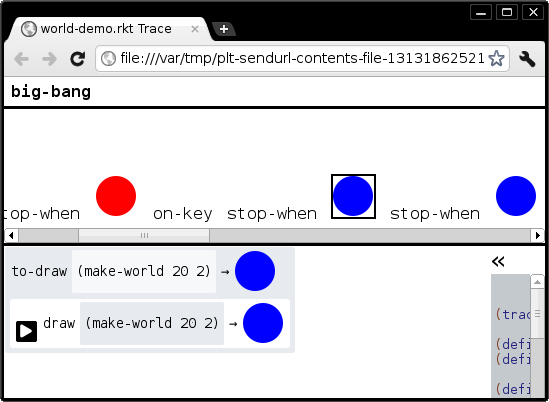
If the big-bang includes a to-draw function, the result of to-draw will replace its name in the second tab bar.
4 Error Tracing
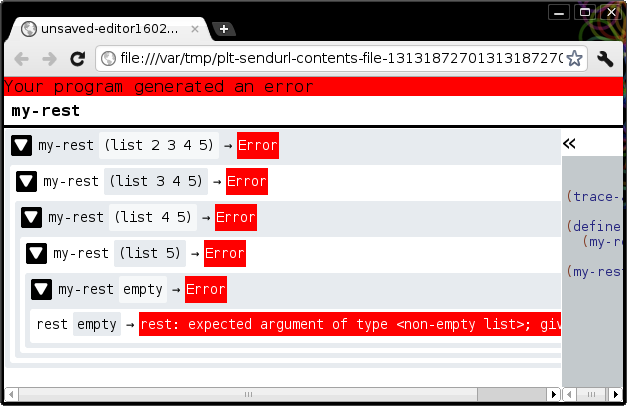
If the traced code throws an error, the trace up to that point will load. Clicking on the red bar along the top will bring you back to the call where the error occurred.
5 Printing
By default, the tracer will not show sharing in values. To show sharing in values add (show-sharing #t) anywhere in the file.
6 Compatibility
Suggested browsers: Firefox, Chrome, or Safari. Other browsers may work, but we don’t test them. #lang planet tracer/tracer currently supports images generated in the code or embedded in the code.